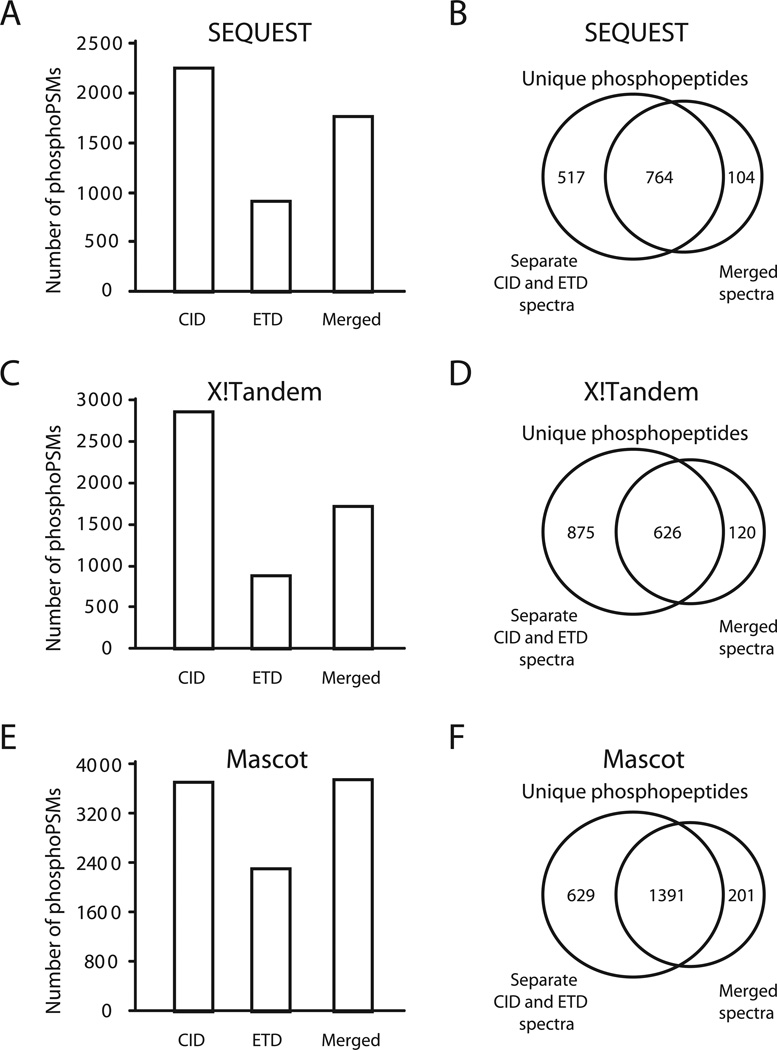
Figure 2.
Comparison of merged versus separate searches of data from alternating CID and ETD experiments. CID, ETD and merged spectra generated from alternating CID and ETD method (Top 3) were searched using SEQUEST (A and B), X!Tandem (C and D) or Mascot (E and F) algorithms. Panels A, C and E show the number of phosphoPSMs, while panels B, D and F show the number of unique phosphopeptides and its Venn diagram.

