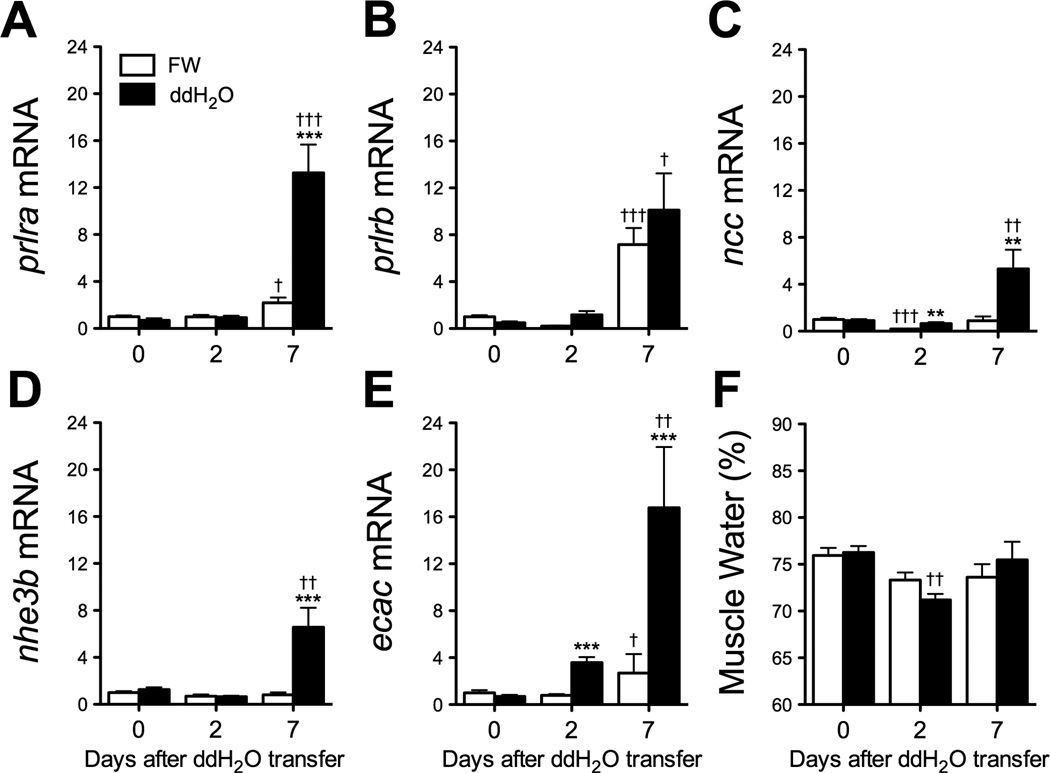
Figure 2.
Changes in branchial prlra (A), prlrb (B), ncc (C), nhe3b (D) and ecac (E) gene expression and muscle water content (F) at 0, 2 and 7 days after transfer of zebrafish adults from fresh water (FW) to ion-poor (ddH2O) water (solid bars). Means ± SEM (n=8–10). Time-matched control fish were maintained in FW (open bars). Gene expression is presented as fold-change from FW controls at time 0. Differences among groups were evaluated by two-way ANOVA. **, *** Significantly different from time-matched FW controls at P<0.01 and 0.001, respectively, by Student’s t-test. †, ††, ††† Significantly different from time 0 at P<0.05, 0.01 and 0.001, respectively, by Dunnett’s test.

