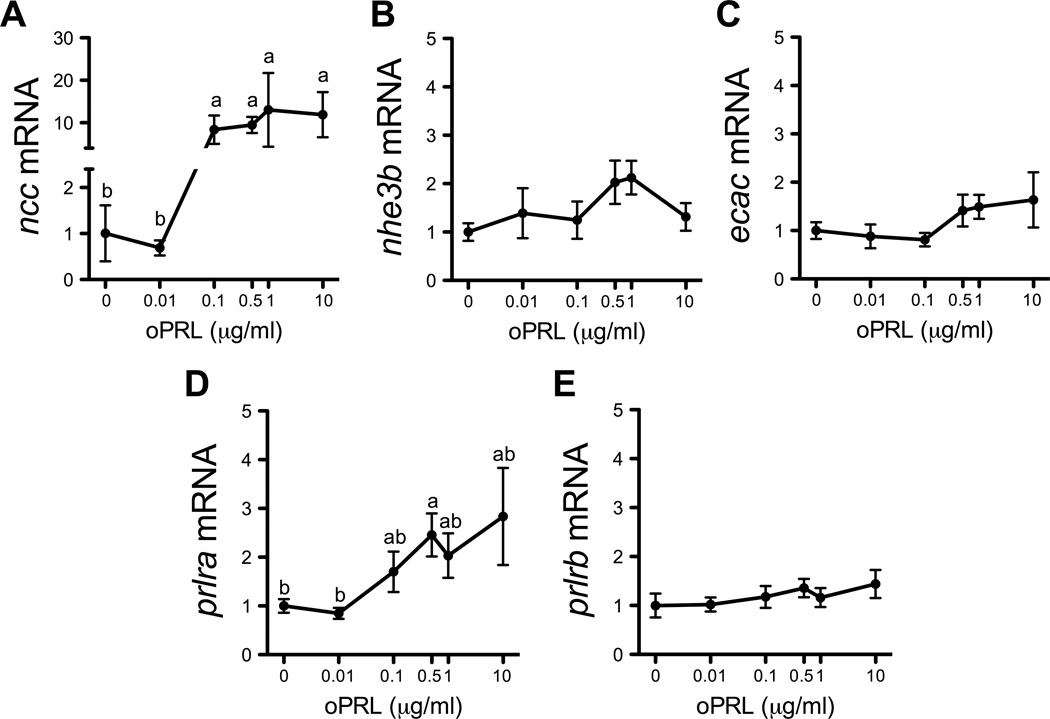
Figure 5.
Effects of oPRL concentration on ncc (A), nhe3b (B), ecac (C), prlra (D) and prlrb (E) gene expression in cultured gill filaments. Means ± SEM (n=6). Filaments were pre-incubated for 3 h, and then incubated with oPRL-supplemented (0.01–10 µg/ml) medium for 8 h. Gene expression is presented as fold-change from the 0 oPRL group. Groups not sharing the same letter are significantly different (ANOVA, Tukey’s HSD, P<0.05).

