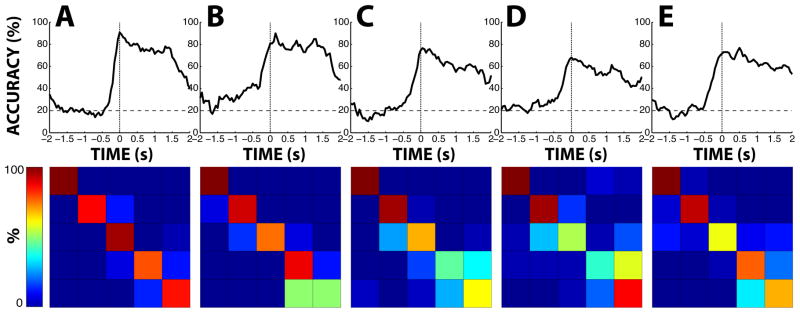
Figure 11. Discrete classification of finger movements.

The top row shows the classification accuracy (i.e., the fraction of all finger movements that were correctly classified) for each subject A-E as a function of time relative to movement onset. Movement onset is marked by the dotted line. Accuracy due to chance (i.e., 20%) is marked by the dashed line. The bottom row shows the confusion matrix of classification at the time of the peak classification accuracy for each subject. In each matrix, each row represents the finger that actually moved (from top to bottom: thumb, index, middle, ring, and little finger). Each column represents the finger that we classified (from left to right: thumb, index, middle, ring, and little finger). In each cell, the color indicates the fraction of all movements of a particular finger that was assigned to the particular classified finger.
