
Figure 2. Example finger flexion.
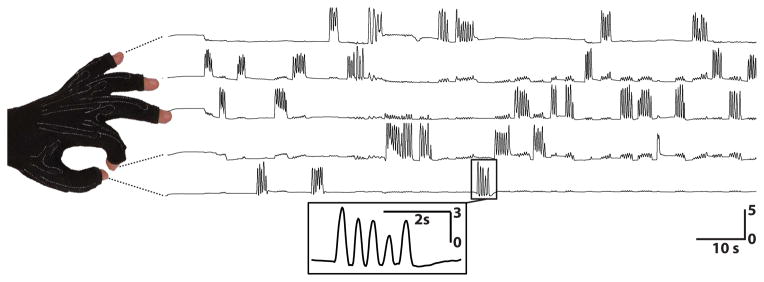
These traces show the behavioral flexion patterns for subject E and each of the five fingers over the first two minutes of data collection. Flexion consisted of movements of individual fingers, accompanied occasionally by minor flexion of other fingers. Horizontal bars give time and vertical bars give units of standard deviation.