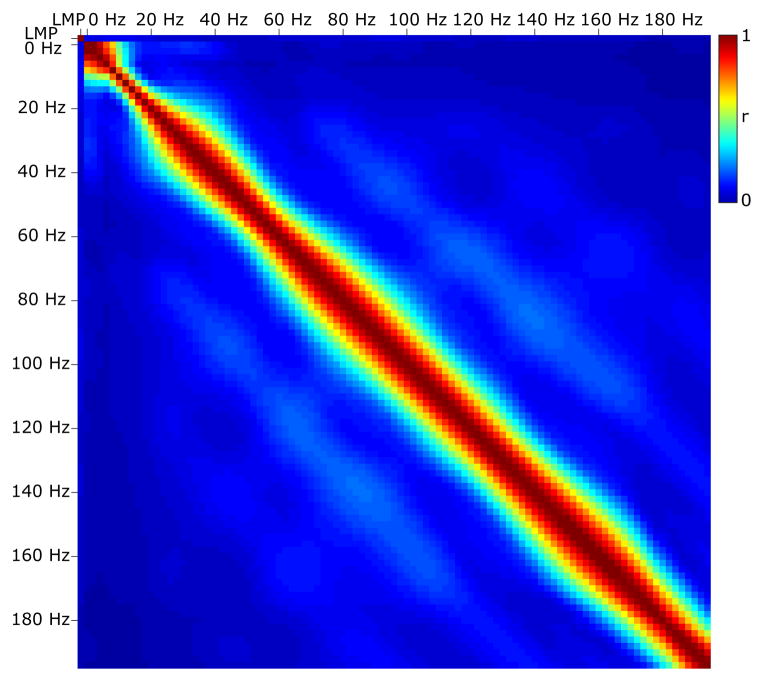
Figure 3. Correlation of features.
This figure shows the correlation coefficient r (color coded – see color bar), calculated for all data between the LMP and amplitudes in different frequency bands. r is very low for the LMP and amplitudes in different frequencies, and generally low for different frequencies.

