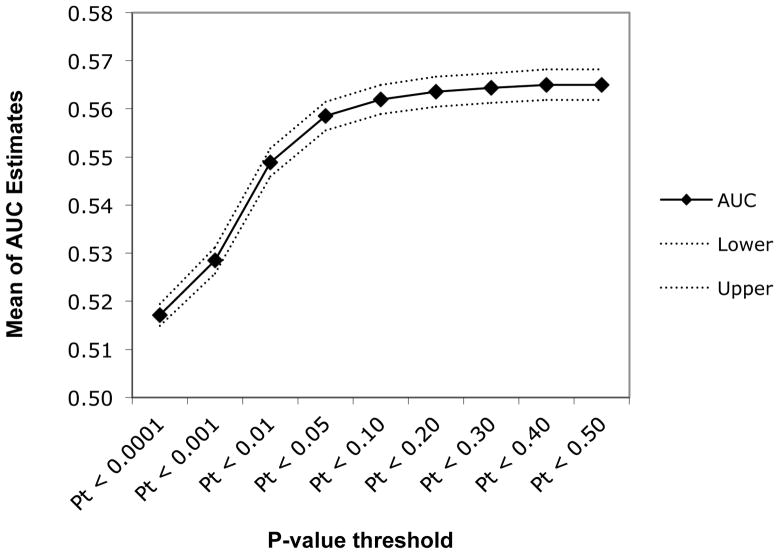
Figure 3.
Mean AUC estimates for varying p-value thresholds. The mean of all 100 AUC estimates for sum scores created using SNPs that meet different p-value thresholds in discovery samples is plotted here in the solid line. Dashed lines represent the upper and lower bounds of the 95% confidence interval of the mean AUC estimate.

