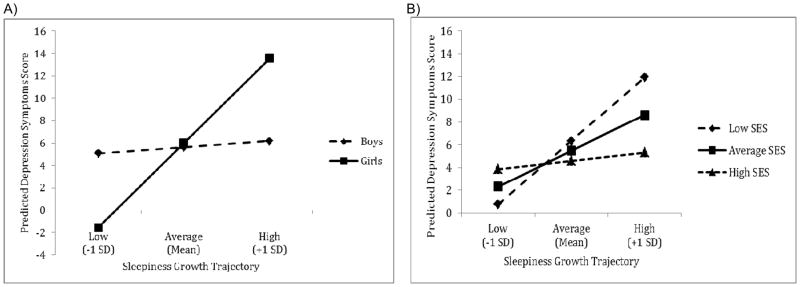
Figure 1.

Predicted differences in adjustment between T1 and T3 associated with (a) lower sleepiness growth trajectories (i.e., initial level and rate of change are 1 SD below the mean), (b) average sleepiness growth trajectories (i.e., initial level and rate of change are at the mean), and (c) higher sleepiness growth trajectories (initial level and rate of change are 1SD above the mean). Sleepiness growth trajectories are represented by points on the plot. That is, each point represents the predicted difference score in the outcome for boys and girls (or low, average, and high SES children) whose sleepiness growth trajectories were low (intercept and slope 1 SD below the mean), average (intercept and slope at the mean), or high (intercept and slope 1 SD above the mean). Panel A illustrates moderation by child sex and Panel B illustrates moderation by family socioeconomic status at T3.
