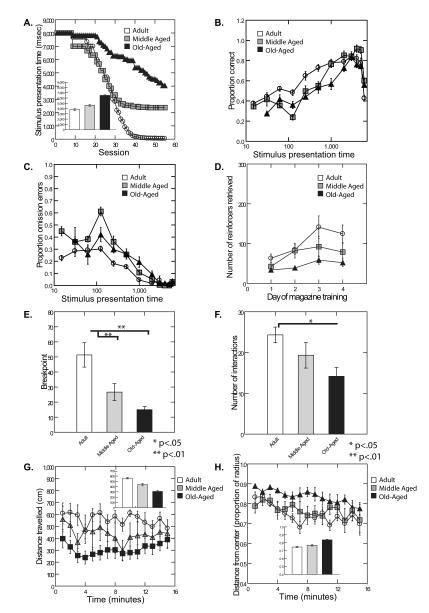
FIGURE 1.
A Acquisition of the CSRTT was analyzed by analysis of the stimulus presentation time during each session as a function of test day, age group, and their interaction, using mixed effects analysis of variance. Significant main effects of age (F(2,20)=243.65, p<.0001), session (F(54,1080)=29.99, p<.0001), and a significant age × session interaction (F(108,1080)=2.56, p<.0001)) were noted. Age-related deficits remained evident during the last five days of testing (F(2, 20)=12.94, p=0.0002), consistent with an age-associated decline in performance even after extended training. Inset shows acquisition averaged across all sessions for the three age groups.
B Proportion of correct trials (number of correct trials/number of trials) as a function of age group and stimulus presentation time. Age cohort was significantly associated with overall performance on the CSRTT (F(2,19)=14.60, p=0.0001), stimulus presentation time (1,811=73.10, p<.0001), and the age cohort × stimulus presentation time interaction effect (F(2,811)=14.38) was significant. Younger animals performed better than older animals at the lower (more difficult) stimulus presentation times than older animals. Error bars represent the standard error of the mean.
C Proportion of omission errors (number of omission errors/number of trials) as a function of age group and stimulus presentation time. The effects of age cohort (F(2,19)=68.48, p<.0001), stimulus presentation time (F(1,811)=842.70, p<.0001), and the age cohort × stimulus presentation time interaction (F(2,811)=21.74), p<.0001) were all highly significant. Younger animals made fewer omission errors than older animals particularly at lower (more difficult) stimulus presentation times. Error bars represent the standard error of the mean.
D Number of rewards received during acquisition during the magazine training portion of the CSRTT is shown as a function of age group and day of training. Age group was associated with the number of rewards retrieved (F(2,20)=21.20, p<.0001), with Adult mice retrieving more rewards than Middle aged mice (F(1,20)=8.34, p=0.0091) and Middle aged mice retrieving more rewards than Old aged mice (F(1,20)=9.97, p=0.005). Error bars represent the standard error of the mean.
E Motivated responding was assessed using the progressive ratio test using an N+2 protocol. Adult animals extended a significantly greater number of nosepokes (higher breakpoint) than both Middle-aged and Old-aged mice [Cohort 1; F(2,20)=18.492, p= 0.000028]. Adult animals differed from Middle Aged animals (p=.008) and Adult animals differed from Old aged animals (p<.0001) by Tukey HSD comparisons. Error bars represent the standard error of the mean.
F Mice from Cohort 1 were subjected to novel object testing and the number of interactions with the novel object were recorded. Significant differences in the number of interactions with the object between the age groups were noted (F(2,20)=5.19, p=0.0153) such that interactions with the novel object declined with advancing age. Adult animals differed significantly from Old aged animals (p<.05) but not from Middle aged animals by Tukey HSD comparisons. Error bars represent the standard error of the mean.
G Motoric behavior was tested using the open field test. Analysis of total distance traveled in the open field during a 15 minutes test revealed significant main effects of age (Cohort 1; F(2,18)=60.24, p<0.0001) but no effect of time and no age group × time interaction effect.
H Anxiety-like behavior was also assessed from the open field, using distance from the center of the open field as an index of anxiety-like behavior. We noted a significant effect of age (Cohort 1; F(2,20)=55.12, p<.0001) and a significant effect of time (F(14,280)=4.21, p<.0001) but no age × time interaction. Error bars represent the standard error of the mean.

