Figure 4.
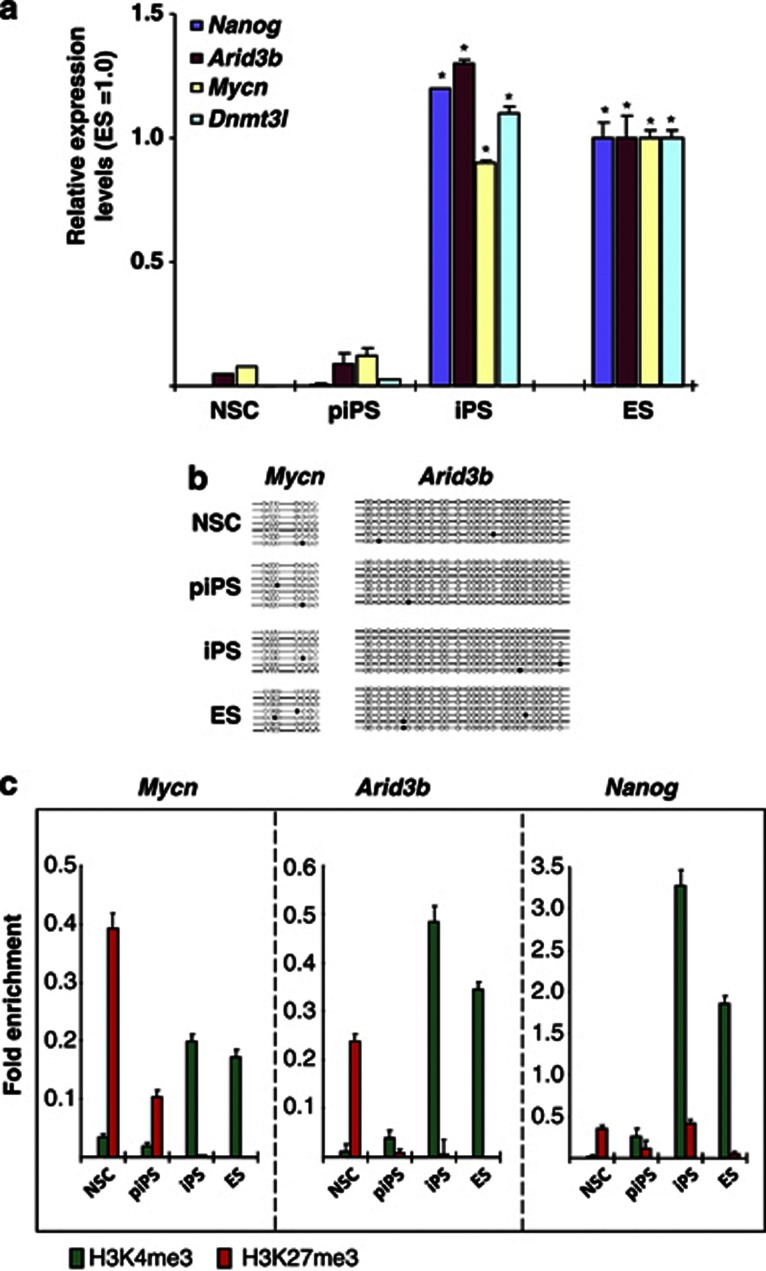
Induction of Arid3b and Mycn during iPS reprogramming. (a) Quantative reverse transcription–PCR measurements of Nanog, Dnmt3l, Arid3b and Mycn expression in NSCs, pre-iPS (piPS) and iPS cells. Each graph shows relative expression levels compared with that in ES cells (1.0). Error bars are s.d.s. P-value was calculated against NSC expression using a two-tailed Student's t-test. *P<0.01. (b) Methylation status of Arid3b and Mycn CpG islands. Each horizontal line indicates a single clone from the respective PCR products after bisulfite treatment. Open circles indicate lack of methylation and filled circles represent methylated cytosine. (c) Chromatin immunoprecipitation analysis for H3K4me3 and H3K27me3 at Mycn, Arid3b and Nanog promoters. Data are represented as fold enrichment of precipitated DNA associated with a given histone modification relative to input chromatin. Active or non-repressed histone modifications (H3K4me3, green) were only observed in iPS and ES cells. Error bars represent s.d.s. Detection level from pull down from normal mouse immunoglobulin G levels are negligible and data not shown.

