
Figure 4.
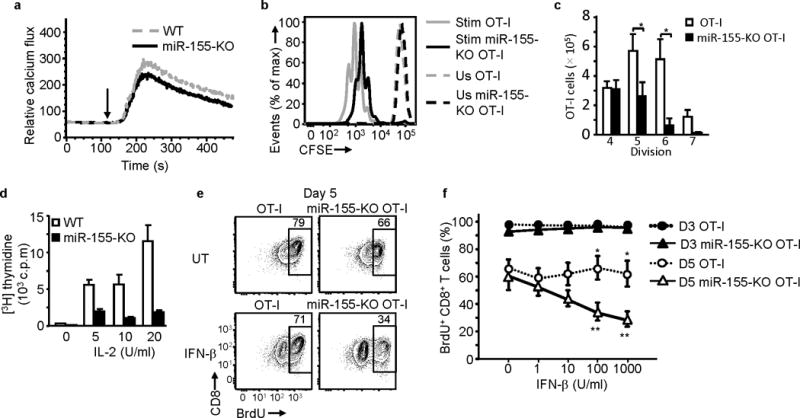
miR-155 deficiency impairs CD8+ T cell proliferation and increases the antiproliferative effect of IFN-β. (a) TCR-stimulated intracellular calcium flux is not affected in miR-155. Representative histogram of 3 experiments performed shown. Arrows indicate stimulation time point. (b) and (c) Purified and CFSE-labeled CD8+ T cells were either left unstimulated (Us) or stimulated (Stim) with OVA(257–264)-pulsed irradiated splenocytes for 4 days. (b) Representative histogram plot of CFSE dilution showing reduced proliferation of miR-155-KO OT-I CD8+ T cells compared to OT-I CD8+ T cells. (c) Bar graph shows mean ± SEM of absolute number of live CD8+ T cells in each division peak. Data from 5 independent experiments ( n = 5 per group). * P< 0.015 (Student’s t-test). (d) Reduced 3H-Thymidine incorporation by purified miR-155-KO CD8+ T cells stimulated with anti-CD3 antibody + IL-2 for 5 days. Bars show mean ± SEM of triplicates of representative experiment of 4 performed. (e) and (f) IFNβ inhibits BrdU incorporation by peptide stimulated miR-155-KO OT-I cells. IFN-β (1000U/ml) was present for the duration of the culture. (e) Representative flow cytometric plots of day 5 of culture depicting IFN-β and untreated (UT) cells. Numbers in plots indicate percent of CD8+ T cells. (f) Day 3 and day 5 BrdU incorporation in response to increasing doses of IFNβ shown. Pooled data from 5 independent experiments shown; * P<0.05 for comparison between OT-I and miR-155-KO OT-I (Student’s t-test); ** P<0.05 for comparison between IFN-β treated and untreated miR-155-KO OT-I (Student’s t-test).