
Figure 5.
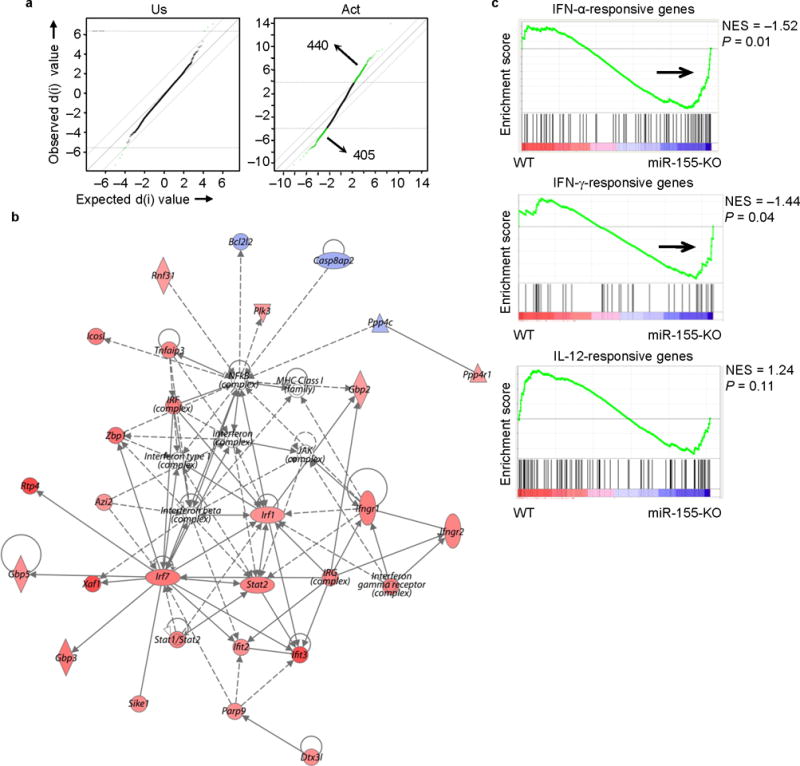
Molecular signature of activated miR-155-KO CD8+ T cells reveals enrichment of genes associated with type I IFN signaling. Microarray analysis was performed on unstimulated (Us) and in vitro activated (Act) CD8+ T cells. (a) SAM plots revealing significant changes in gene expression between activated miR-155-KO and wild-type CD8+ T cell groups (right panel) when compared to differences between naive groups (left panel). Numbers in plots indicate number of genes. (b) A network of type I IFN-related genes is up-regulated in activated miR-155-KO CD8+ T cells. The intensity of the color (red) represents expression level or upregulation. Direct (solid line) and indirect (dotted line) relationships between genes are indicated. (c) GSEA showing an enriched profile of genes associated with IFN signaling pathways in activated miR-155-KO CD8+ T cells. Microarray analysis were performed with an n = 3-4 per group.