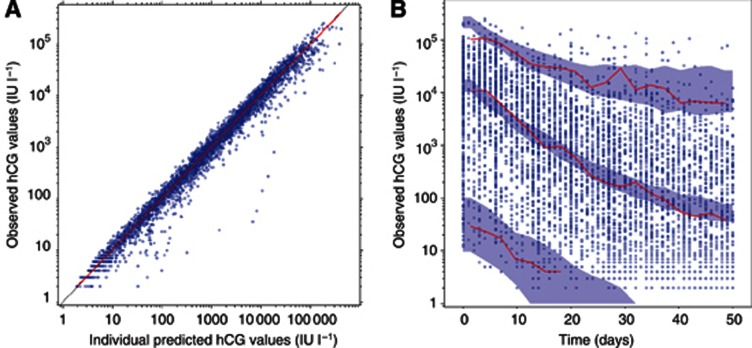
Figure 2.
Internal qualification of the model in Model data set patients (n=418 patients).
(A) Observed vs individual predicted hCG titres (blue circles), identity line (black line), smooth line of the cloud of points (red line). (B) Visual predictive checks of hCG concentrations. The observations are symbolised by the blue circles, and the median, 5% and 95% of observations are represented by red lines. Blue areas represent the 95% prediction interval for the median, 5% and 95%, computed from1000 simulated replicates. A full colour version of this figure is available at the British Journal of Cancer journal online.

