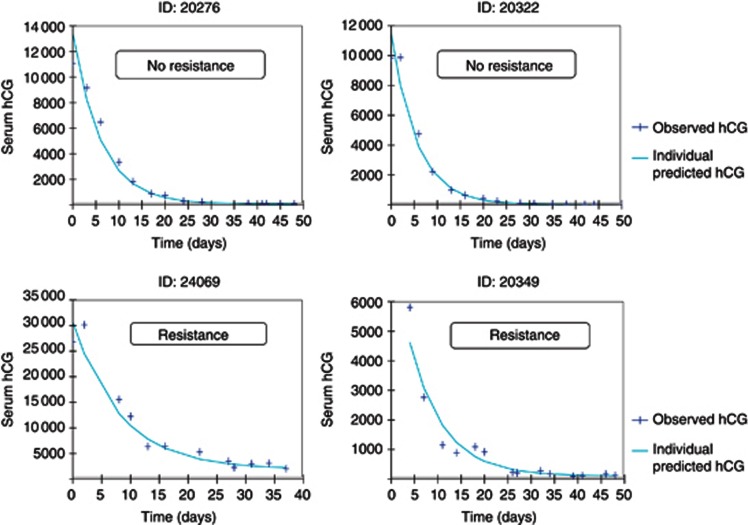
Figure 3.
Examples of four typical patients of Model data set.
The blue dots are the observed hCG values while the green line represents the individual predicted values. Resistances to MTX are specified. A full colour version of this figure is available at the British Journal of Cancer journal online.

