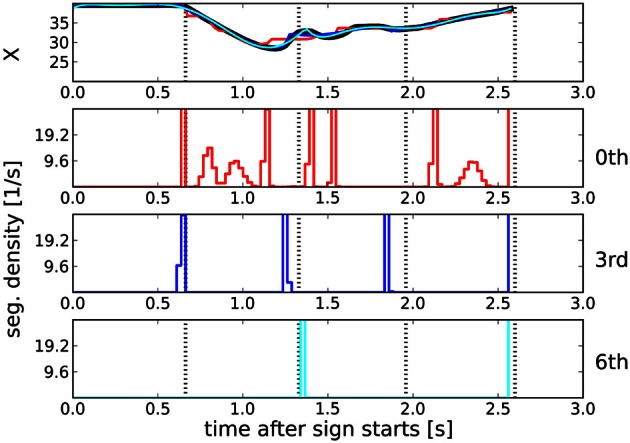
Figure 4.

Top panel: Trajectory of X coordinate (black line) and posterior expected trajectories for observation models of 0th (red), 3rd (blue), and 6th (cyan) order. All observation models provide a good fit. Vertical dotted black lines indicate ground truth segmentation points in all panels. Lower panels: Segmentation densities (i.e., probability density of segmentation boundaries) for these observation models. The 3rd order model puts boundaries close to the ground truth, with no false positives in this example.
