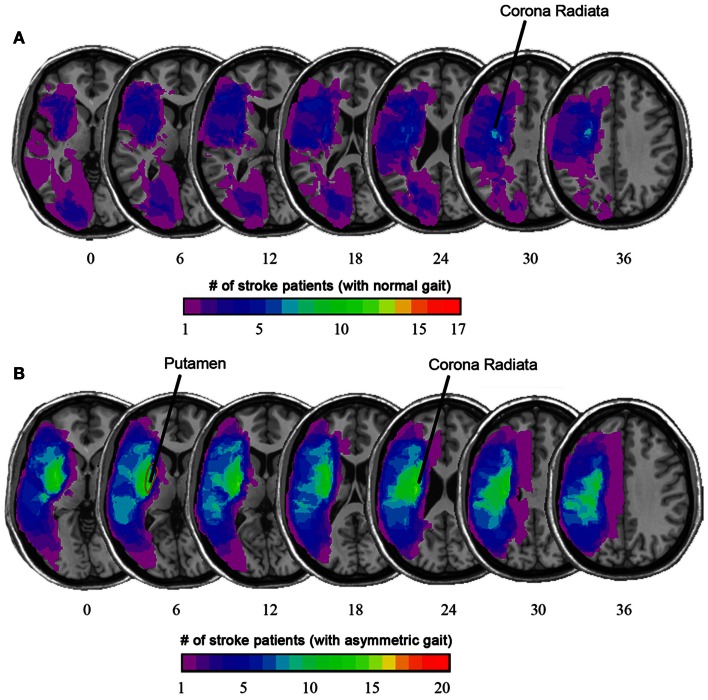
Figure 4.
(A) Overlaid on the average T1-weighted image is a color map showing the average lesion location as a proportion of stroke patients with normal gait. (B) Among stroke patients with asymmetric gait, there was a higher prevalence of stroke lesion that included the putamen and corona radiata. (Based on Alexander et al., 2009).

