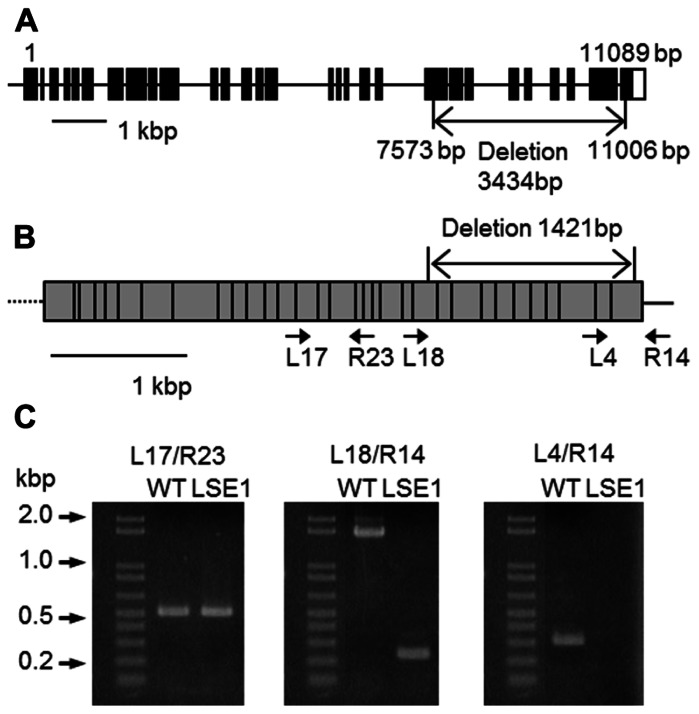
FIGURE 3.
Structure of OsGWD1 and its transcript. (A) The gene structure of OsGWD1 is illustrated; black boxes indicate exons and the position of the gene deletion in LSE1 mutant is shown by an arrow. (B) The coding region of the OsGWD1 transcript is indicated by a gray rectangle, in which the junctions of the exons are shown by vertical bars. The positions of the PCR primers used for the analysis of the transcript structure are indicated by the arrow heads (see below). Note that the primers L17, L18, L4, and R23 span the exon/intron junction on the cDNA. (C) Agarose gel electrophoresis images of the PCR products are presented to demonstrate that an aberrant transcript is accumulated in the leaves of LSE1 plants. The results of PCR with the different primer pairs are shown.

