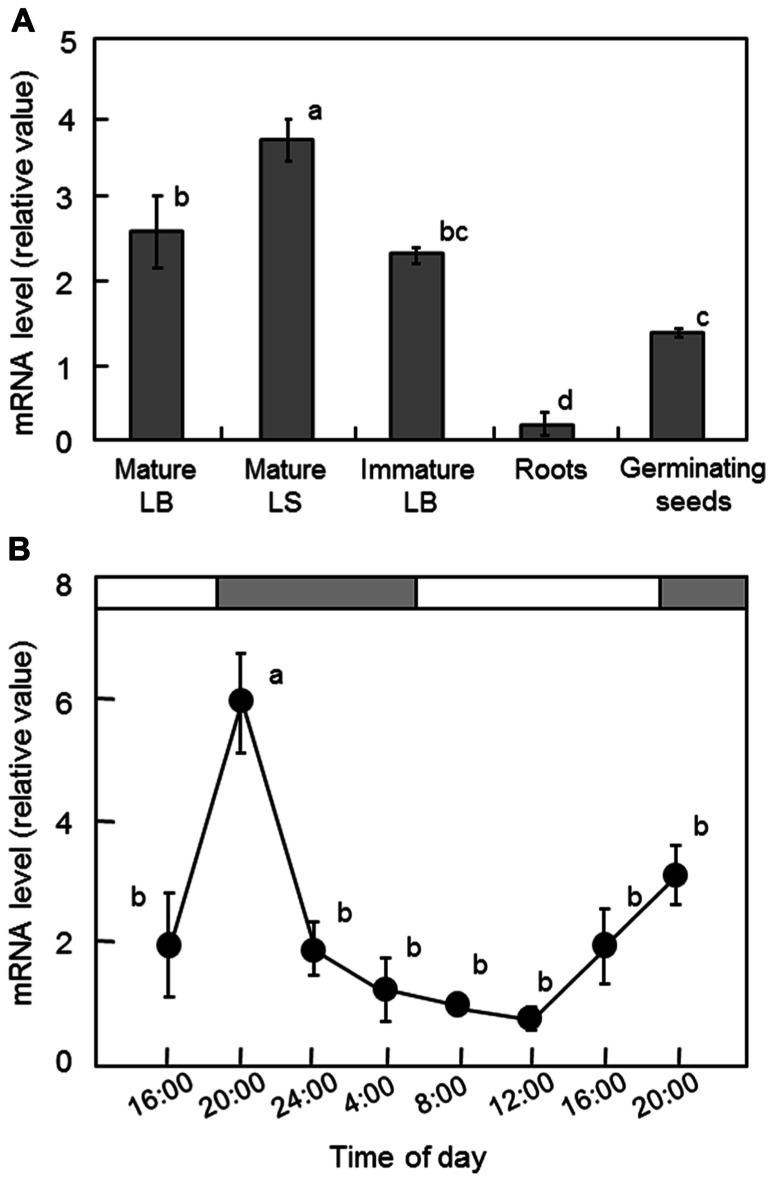
FIGURE 4.
Transcript levels of OsGWD1 in rice seedlings. Tissue-specific accumulation pattern (A) and diurnal changes in leaf blades (B), with respect to the mRNA levels of OsGWD1 were examined by quantitative RT-PCR analysis. Values are standardized to the expression level of a rice polyubiquitin gene (% RUBIQ1). Data represent the mean ± SE (n = 4) and the different letters indicate significant differences (p < 0.05, Tukey’s test). LB, leaf blade; LS, leaf sheath.

