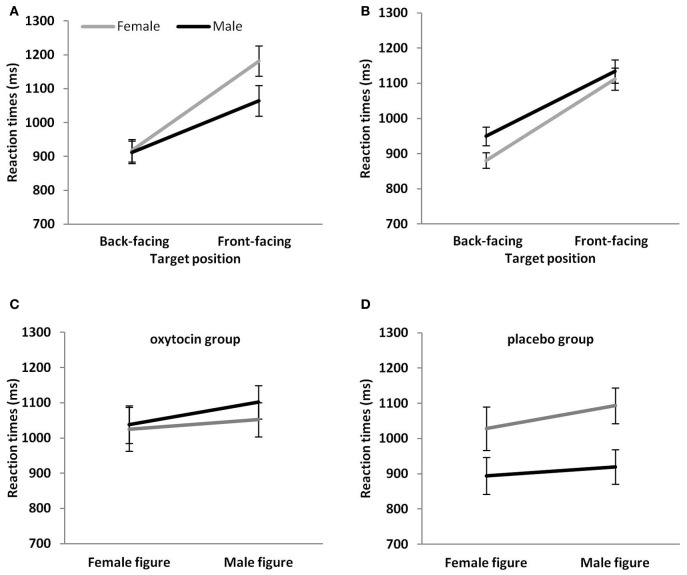
Figure 2.
Mean reaction times (A) of male and female participants to target figures in the back- and front-facing position, (B) to male and female target figures in the back- and front-facing position, (C) of male and female participants to target figures in the OT group and (D) the placebo group. Vertical bars indicate standard errors.

