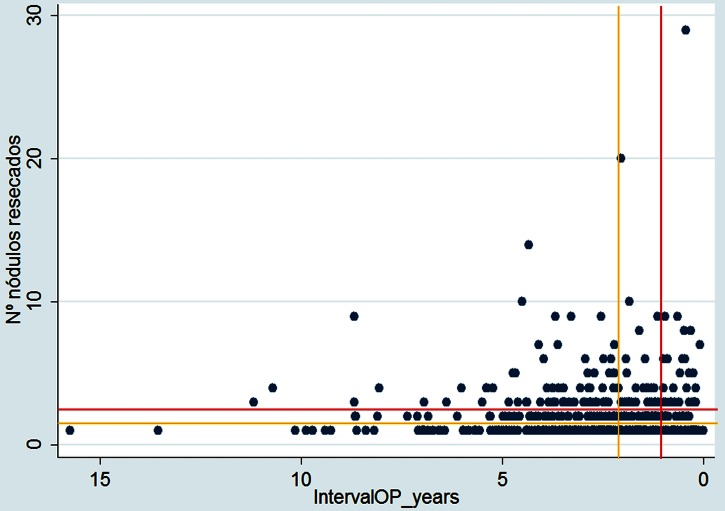
Figure 12.
Scatterplot of the interoperative interval and number of metastases. The red lines demarcate the thresholds (an interval of less than 12 months and 3 or more metastases) beyond which outcomes were always poor in the Duke/MSK-CC experience.13 The amber lines demarcate the thresholds in most of the meta-analyses by Gonzales et al,3 again indicating the patients likely to recur above and to the right of the pair of lines. The factors which are favourable for survival (solitary metastasis and long interval) are to the bottom left of the graph where one might anticipate the concentration of patients to be. It appears that selecting patients with fewer metastases occurs more naturally than deliberately delaying surgery for the selected few with longer intervals.

