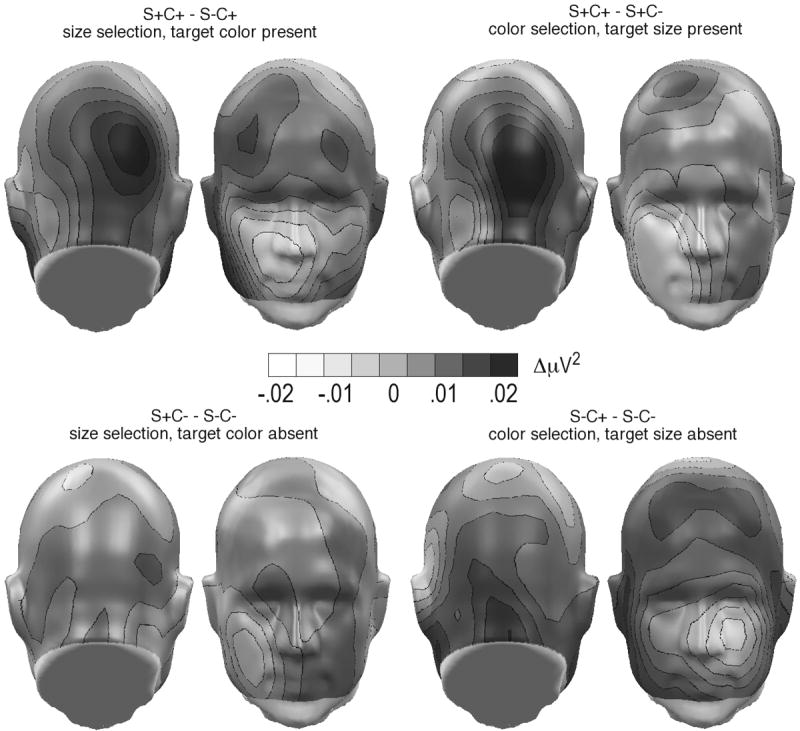
Figure 6.

Spline-interpolated topographical distribution of high induced GBA power changes (back and front views), for the four condition differences of interest. Top row: selection with second target feature present; bottom row: selection with no other target feature present. Note the selective GBA enhancement for stimuli sharing the overall configuration of the target (color and shape). Areas below the nose level in the front view represent extrapolated values.
