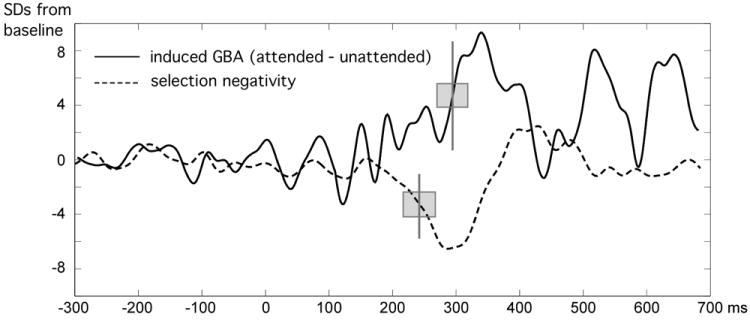
Figure 7.

Grand mean time series for the SN and GBA for the conditions with an additional target feature present (i.e. selection of two features), expressed in standard deviations from a baseline mean. The time series for the GBA was extracted from the posterior sites used for creation of time-frequency plots, i.e., P3/P4, P7/P8, P03/PO4, P07/P08, 01/02, and P9/P10. Thus, the time series mainly reflects late induced GBA, which showed broader topographical distribution. Secondary GBA peaks around 500 and 650 ms reflect non-systematic changes in the response time window (see also the time-frequency plots above). Vertical lines indicate the 50% criterion applied for latency analyses by means of jackknifing; the gray box reflects the jackknifed standard deviation.
