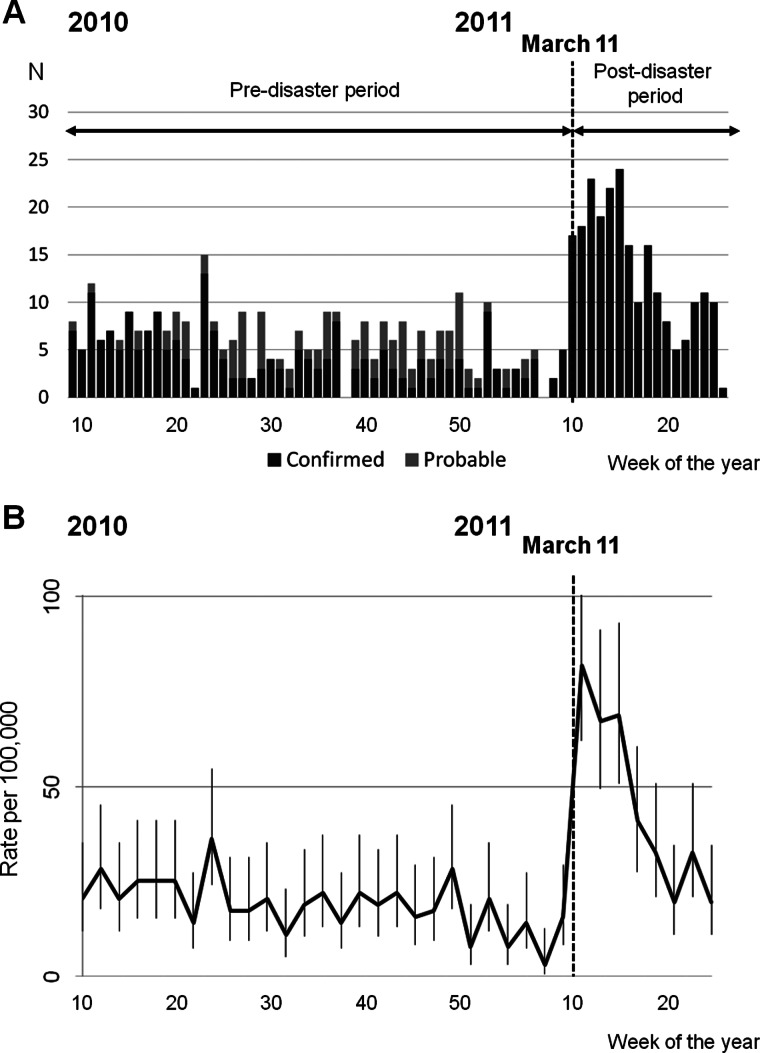
Figure 2.
Trend of pneumonia hospitalisations in Kesennuma City, March 2010 to June 2011. (A) Weekly number of confirmed and probable cases according to the date of onset. (B) Biweekly incidence rates (per 100 000 people) calculated according to the date of onset. Cases were limited to the residents of Kesennuma City. The vertical lines indicate 95% CI.

