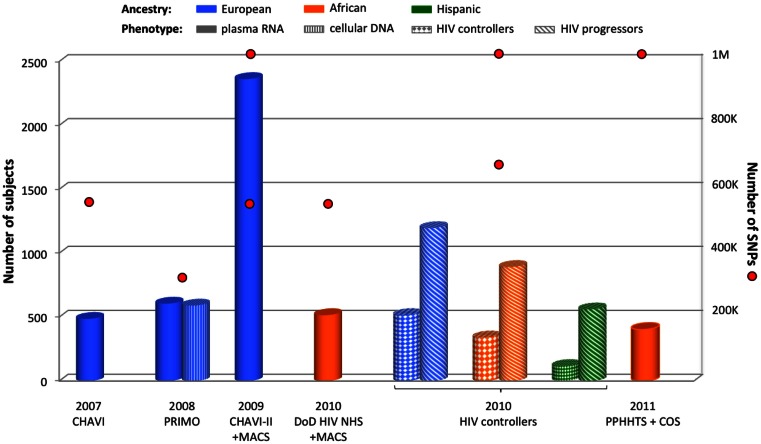
Figure 1.
Summary of GWAS design focusing on viral load control. The histogram presents the number of subjects and red circles display the number of SNPs covered by the genotyping arrays. Two red circles are symbolized for one cohort when individuals were genotyped using two sets of arrays. Individual ancestry is color-coded: blue for European, orange for African, and green for Hispanic. The pattern of each cylinder illustrates the phenotype of interest: plain color for plasma RNA, vertical stripes for cellular DNA, solid diamonds for HIV controllers, and diagonal stripes for HIV progressors.

