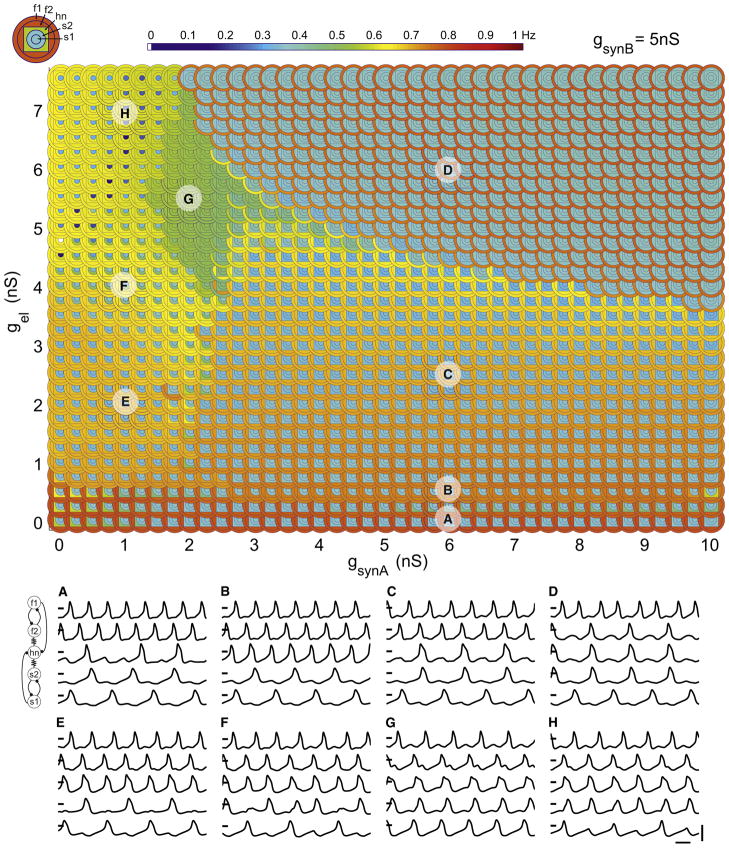
Figure 5. Parameterscape of Network Frequencies as a Function of gel and gsynA.
A plot showing the firing frequency of each of the five cells in the model network, color coded according to the key (top left) with the color scale to the right of the plot. Each cell corresponds to a concentric ring from outermost to innermost as follows: f1, f2, hn (square), s2, and s1. Within the parameterscape, regions of patterned network activity and hub neuron switching are apparent.
(A–H) Example voltage traces corresponding to each labeled region. Traces from top to bottom are f1, f2, hn, s2, and s1. (A) hn oscillates irregularly at low frequency (gsynA = 6 nS, gel = 0 nS). (B) As electrical conductance is increased (gsynA = 6 nS, gel = 0.5 nS), hn switches its activity to join the fast rhythm. (C) A further increase in electrical conductance causes hn to oscillate in time with the slow rhythm (gsynA = 6 nS, gel = 2.5 nS). (D) Increasing electrical conductance further still (gsynA = 6 nS, gel = 6 nS) leaves hn oscillating in time with the slow rhythm; however, f2 also oscillates with the slow rhythm. (E) hn oscillates in time with the fast rhythm (gsynA = 1 nS, gel = 2 nS). (F) hn again oscillates in time with the fast rhythm but s2 oscillates irregularly (gsynA = 1 nS, gel = 4 nS). (G) All cells in the network oscillate at the same intermediate frequency (gsynA = 2 nS, gel = 5.5 nS). (H) hn oscillates at a slightly higher frequency than in (G) along with all other neurons except for s1, which oscillates at half this frequency (gsynA = 1 nS, gel = 7 nS). All traces: scale bars represent 100 mV, 1 s; intersecting marks = 0 mV.

