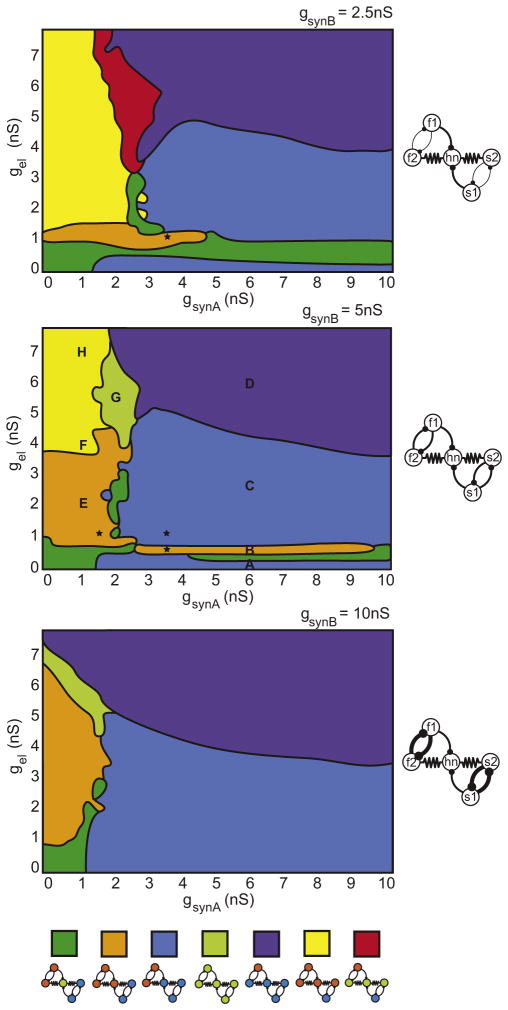
Figure 7. Network Activity for Different Half-Center Coupling Strengths.
Schematic maps of network frequency relationships for different values of half-center coupling strength, gsynB = 2.5 nS, 5 nS, and 10 nS (top to bottom). Each colored region represents a different class of network activity as shown by the legend at the bottom (blue cells = oscillating in time with slow rhythm, green cells = oscillating at intermediate frequency, orange cells = oscillating with fast rhythm). Black stars correspond to the activity shown in Figure 8.

