
Fig. 4.
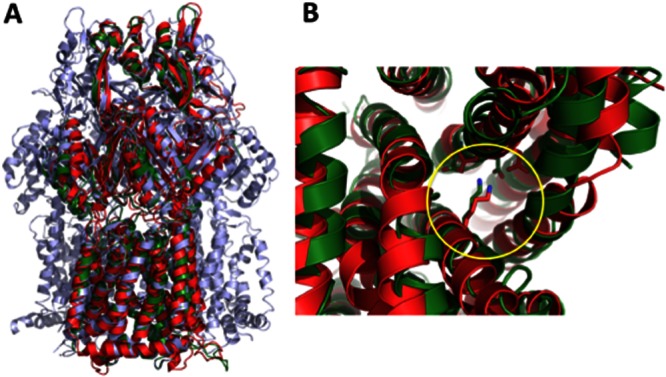
A homology model for MtrD.
A. An overlay of the MtrD models with AcrB trimer. The MexB-based model is in green; the AcrB-based model is in red; and the AcrB 2DHH structure is shown as a light blue trimer. This figure was generated using Pymol.
B. This homology modelling allows for an unambiguous location of the residues in the TM helices, and as can be seen, D405, D406 and K948 (highlighted by a yellow circle) appear within bonding distance in both models. In combination with our biochemical data, this provides very strong support to the idea of conservation of this charged network across different RND transporters and the clearly indicates that these residues perform in a similar fashion to these previously established in AcrB.