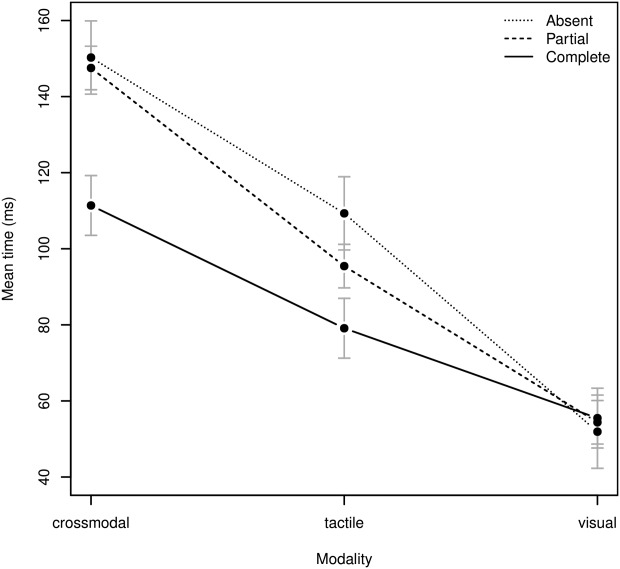
FIG. 1.

Interaction plot with standard error of the estimates showing the 2-way interactions between modality and sensory trick after averaging tdt and toj (absent, no sensory trick group; partial, partial sensory trick group; complete, complete sensory trick group).
