
Fig. 1.
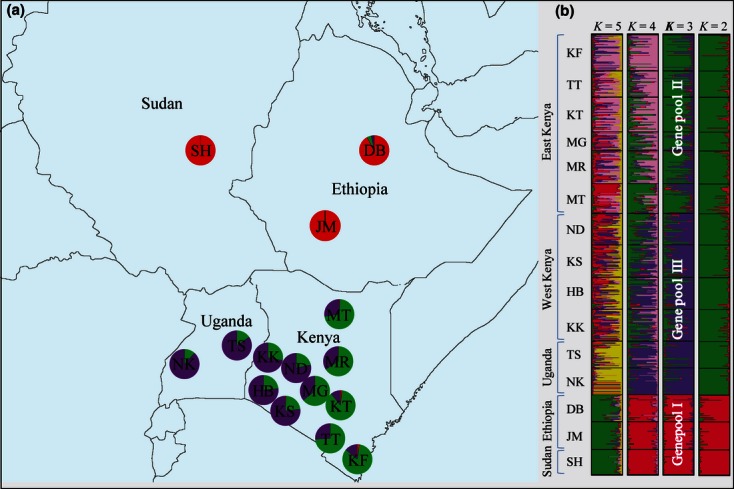
(a) Geographic distribution of village chickens. The shaded area in each pie is proportional to the number of individuals in each population observed for each gene pool. (Population abbreviations: East of Kenya: KF, Kilifi; TT, Taita; KT, Kitui; MG, Muranga; MR, Meru; MT, Marsabit; West of Kenya: KS, Kisii; ND, Nandi; HB, Homa Bay; KK, Kakamega; Ethiopia: DB, Debre Berhan; JM, Jimma; Sudan: SH, Shilluk; Uganda: TS, Teso; NK, Nkonjo). Colour codes: Red, Gene pool I; Green, Gene pool II: Purple, Gene pool III. (b) Bayesian analysis of population structure of East African village chickens. Individuals (represented by single vertical lines) are assigned to three distinct gene pools based on clustering result at K = 3. Colour codes: Red, Gene pool I; Green, Gene pool II; Purple, Gene pool III.