
Fig. 2.
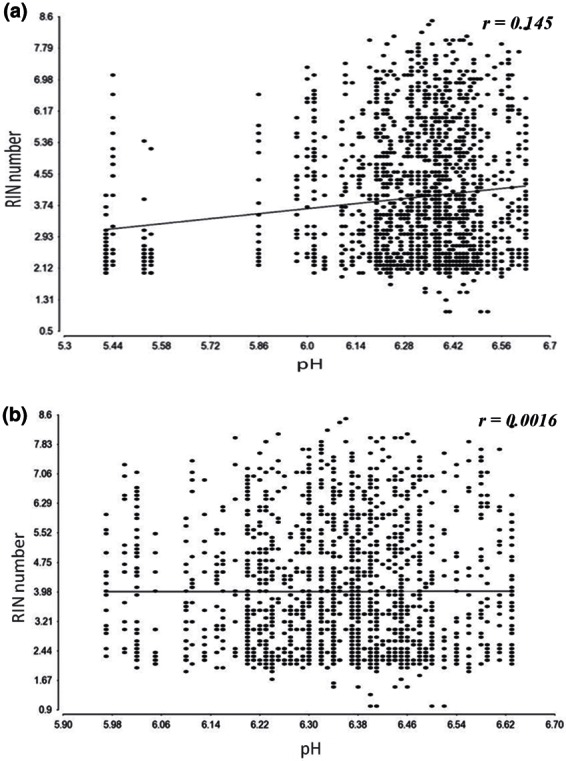
(a) Scatter plot for total RNA samples with linear regression line of RIN numbers for pH. Plot shows the effect of pH on RIN number for RNA samples isolated from 13 region of control brain tissue. Test p-values is test p-value = 1.0 × 10⁻⁴, r-value = 0.145. Including the low pH values of < 5.9. (b) Scatter plot for total RNA samples with linear regression line of RIN numbers for pH. Plot shows the effect of pH on RIN number for RNA samples isolated from 13 region of control brain tissue. No significant correlation was obtained with r-value = 0.0016 and p-value = 0.82. Samples with low pH value of < 5.9 were excluded.