
Fig. 2.
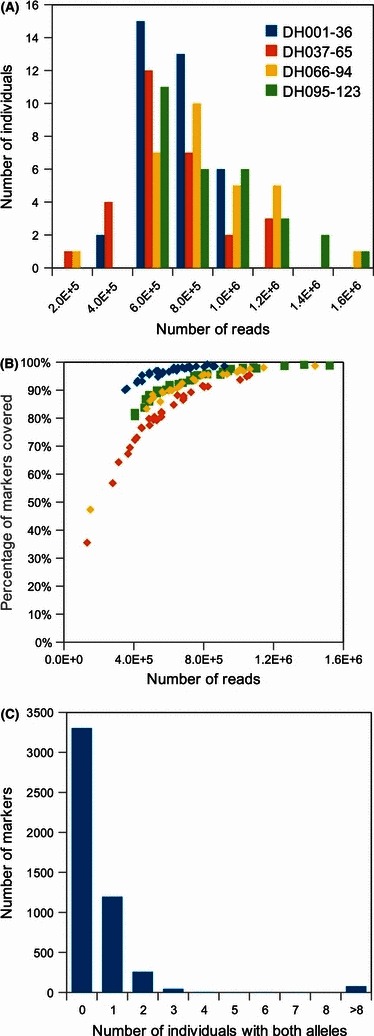
Single nucleotide polymorphisms (SNP) genotyping using next-generation sequencing. (A) Histogram showing the number of filtered reads generated per individual. The four restriction-site associated DNA (RAD) libraries are shown separately in different colours. (B) Scatter plot showing the relationship between the number of reads per individual and the percentage of the 4888 WR × Sw polymorphic markers that have at least one sequence read in that individual. (C) Histogram showing the number of doubled haploid progeny with both alleles present for the polymorphic markers.