
Fig. 3.
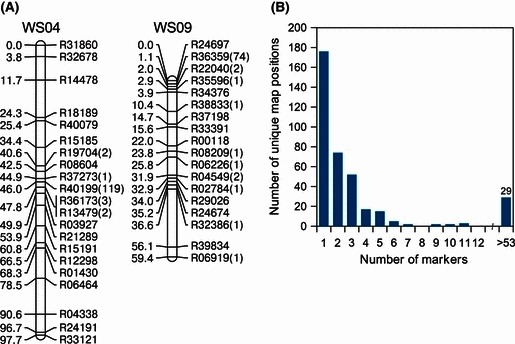
Overview of the WR × Sw genetic map. (A) Two example linkage groups from the WR × Sw (WS) genetic map. Genetic distances are Kosambi centimorgans. Locus names are shown for the subset of marker loci used in final ordering. The number of additional markers at each position is shown in parenthesis. (B) Histogram showing the number of markers per unique map position.