
Fig. 4.
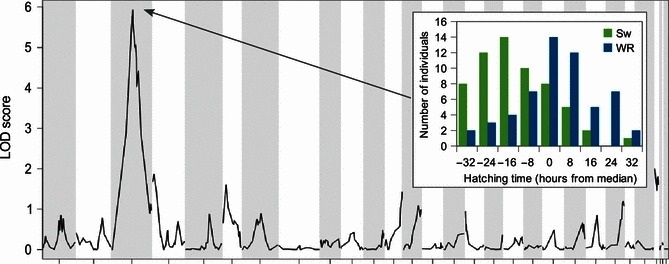
Quantitative trait locus (QTL) analysis of development rate. Development rate logarithm of odds (LOD) profiles for each of the 29 linkage groups. The linkage groups are shown in order, the background is shaded for every other group, and tick marks along the x-axis represent the centre of each group. The inset histogram represents the development rate phenotypic profile for individuals that inherit either the Sw or WR allele at the major QTL peak. [Correction after online publication 28 October 2011: the first word of the caption was corrected to ‘Quantitative’].