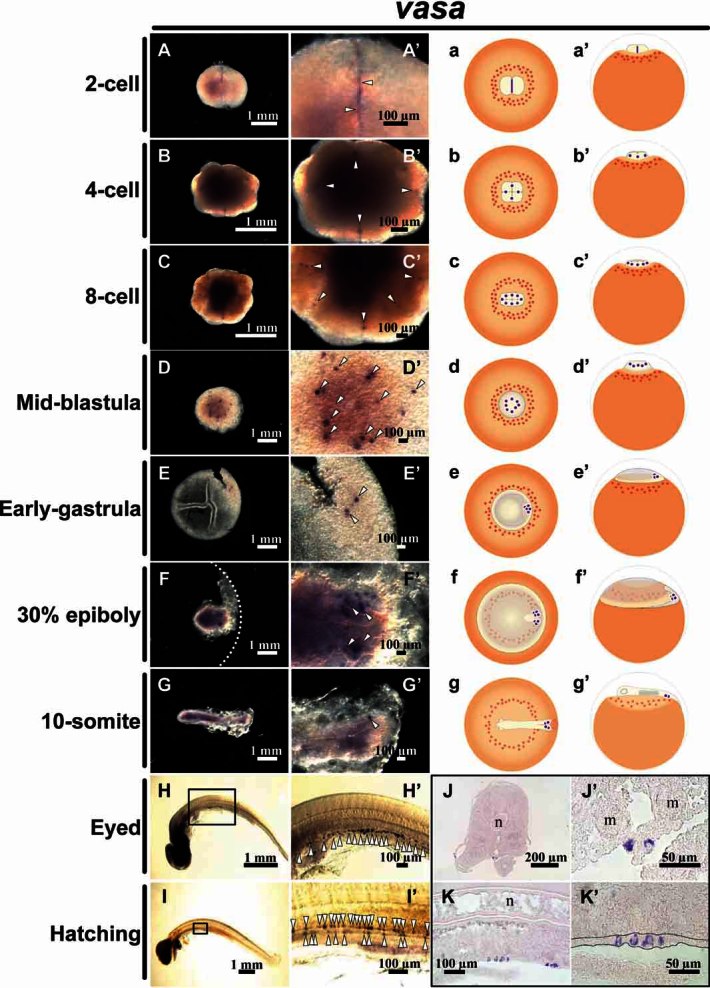
Figure 4.

Localization patterns of vasa transcripts and PGCs in Atlantic salmon embryo. Whole-mount in situ hybridization with vasa probe at different developmental stages (A–I, A′–I′). Transverse or longitudinal sections of the embryo subjected to hybridization with the vasa probe at the beginning of eye-pigmented stage (41 dpf) (J and K, J′ and K′). (A′–K′) are high-magnification views of (A–K), respectively. Arrowheads indicate the localization of vasa transcripts. Dotted lines in F and K′ indicate the edges of blastoderm and presumptive genital ridge, respectively. m, mesonephric duct; n, notochord (a–g, a′–g′). The schematic representation of the localization vasa transcripts and PGC distribution in the Atlantic salmon embryo at two-, four-, eight-cell, mid-blastula, early-gastrula, 30% epiboly, and 10-somite stages. The vasa signals and PGCs are represented in purple (line or dots) in the schematic representation. (a–g) and (a′–g′) are anterior and lateral views of embryo, respectively.
