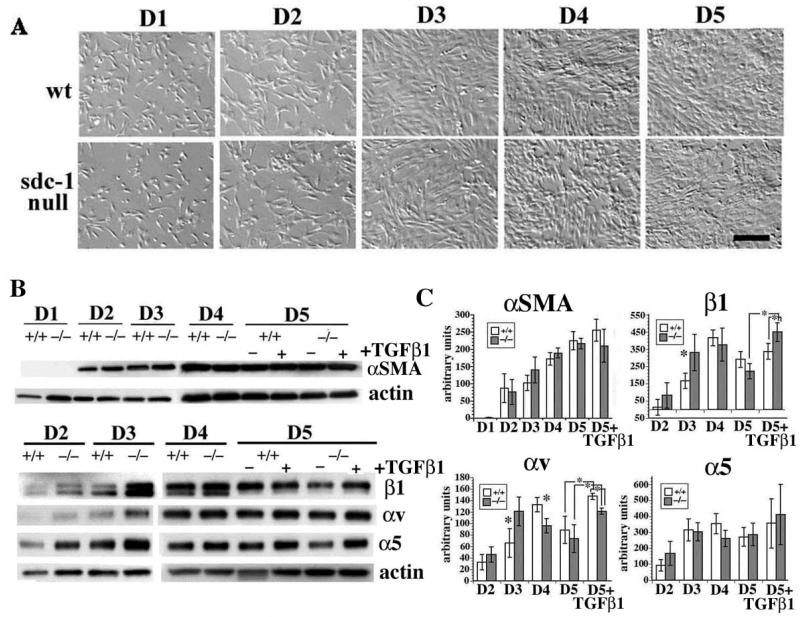
Figure 1. Primary cell cultures of sdc-1 null fibroblasts show transient up-regulation of total integrin expression compared to wt fibroblasts.
A. Relief contrast images of primary fibroblasts taken after the indicated number of days in culture showed that wt and sdc-1 null fibroblasts reach confluence between days 3 and 5. Bar = 15 μm. B. Immunoblot analyses of αSMA, as well as β1, αv, and α5 integrins with actin levels serving as loading controls. C. Quantification of the data presented in B using NIH-Image. A minimum of 3 different sets of fibroblasts were used for each protein quantified. Asterisks in C indicate data found to be significant at p <0.05 by Student’s t test.

