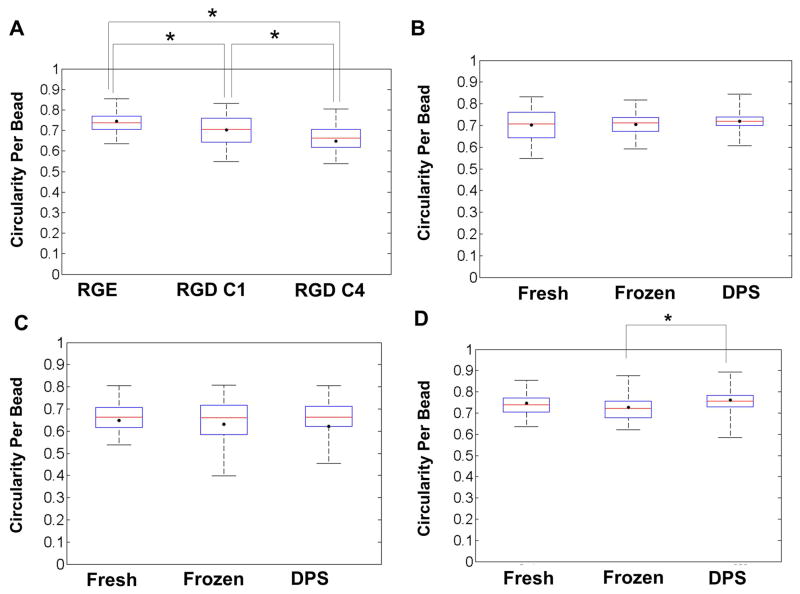
Figure 4.
Box plots displaying circularity per bead for A) Fresh RGE, RGD C1 and RGD C4, B) RGD C1 Fresh and Cryopreserved, C) RGD C4 Fresh and Cryopreserved, and D) RGE Fresh and Cryopreserved groups. ● average bead circularity for each group, and whiskers on each plot extend from minimum to maximum values of bead circularity within a given group. The middle line in each box represents the median and the bottom and top of each box represent the 25th and 75th percentile, respectively. n=3 for 3 independent encapsulations/cryopreservations. Ten to twenty beads per treatment were analyzed. Beads from RGD C1 and C4 groups were cryopreserved one and four days post-encapsulation, respectively.

