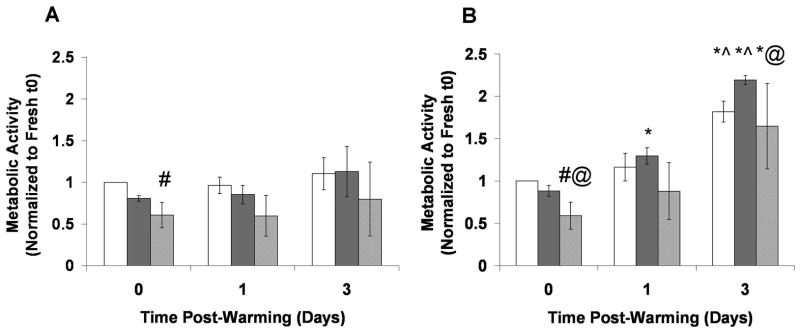
Figure 5.

Metabolic activity over time in Fresh and Cryopreserved stable C2C12 cells encapsulated in hydrogels and cultured A) 1 (RGD C1) or B) 4 (RGD C4) days post-encapsulation. Cryopreserved groups and Fresh controls were assessed up to 3 days post-warming. All groups were normalized to the Fresh group at t0. The Fresh group is represented by the white bars, the Frozen group by the dark gray bars, and the DPS-vitrified group by the light gray bars. *p<0.05 compared to same group at t0, ^p<0.05 compared to same group at one day post-warming, #p<0.05 compared to Fresh group at same time point, @p<0.05 compared to Frozen group at same time point. n=3.
