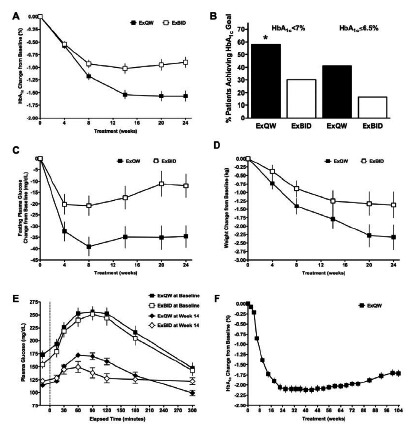
Fig. (11).

(A-D) Comparison of treatment effects for ExQW versus ExBID over 24 weeks in the duration-5 phase 3 clinical trial in treatment-naíve patients with T2DM. (A) HbA1c change from baseline. LS mean±SEM. (B) Proportion of subjects achieving HbA1c targets at study end. *p<0.0001. (C) Fasting plasma glucose change from baseline. LS mean±SEM. (D) Body weight change from baseline. LS mean±SEM. ITT population: ExQW n=129; ExBID n=123. (A-D adapted from reference [114]). (E) Comparison of postprandial glucose effects after a normal meal in patients treated with ExQW or ExBID at baseline and at Week 14 in the duration-1 phase 3 clinical trial in patients with T2DM. ExQW n=27; ExBID n=24. (Adapted from reference [117]) (F) HbA1c change from baseline in the 2-year extension of the duration-1 clinical trial. 2-year completer population: ExQW n=216. LS mean±SEM. (Adapted from reference [119]).
