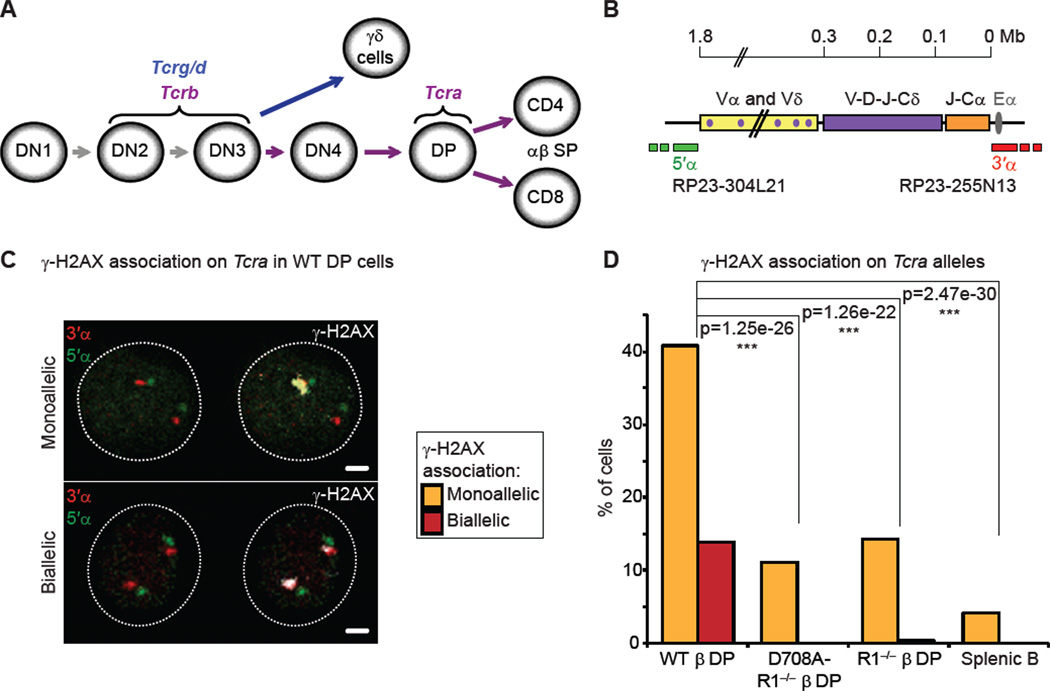
Figure 1. Recombination of Tcra occurs on one allele at a time in DP cells.
(A) Recombination of the 4 Tcr loci at different stages of T cell development.
(B) Scheme representing the Tcra/d locus. Probes for 3D-DNA FISH were generated from BACs hybridizing outside of the Vα segments (5’α, green) and of the Cα region (3’α, red).
(C) Confocal sections showing examples of γ-H2AX association (in white) on Tcra alleles (3’α in red and 5’α in green) in WT DP cells: mono-allelic association on the top panel, and bi-allelic association with the two foci of different size and intensity, on the bottom panel. Scale bars = 1 µm.
(D) Frequency of γ-H2AX association on Tcra in WT, RAG1-mutant DP cells and splenic B cells. The p values calculated using a two-tail Fisher exact test are shown as: -ns- no significance (p ≥ 5.00e-2), -*- significant (5.00e-2 > p ≥ 1.00e-2), -**- very significant (1.00e-2 > p ≥ 1.00e-3), -***- highly significant (p < 1.00e-3). Graphs and p values represent a combination of two independent and representative experiments (individual data sets and full statistical analyses in Table S1). See also Figure S1.

