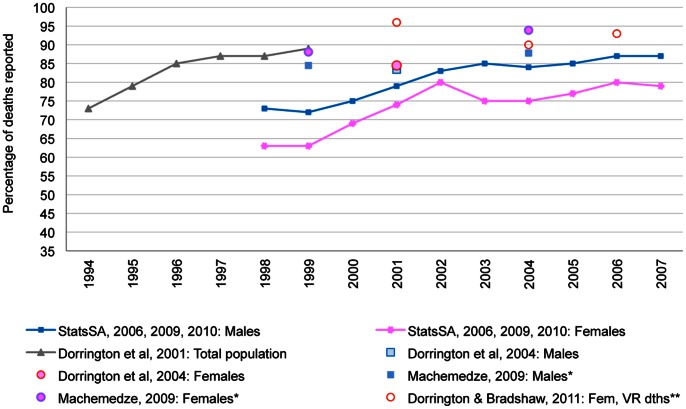
Figure 1. Estimated completeness of death reporting in South Africa: 1994–2007.
Notes: *1999 and 2004 are used as midpoints between Census 1996 and Census 2001, and Census 2001 and Community Survey 2007, respectively. **Estimates apply to ages 5–85 years. 2004 was used as midpoint for the period 2001–2007. While the source [33] includes separate GGB and SEG estimates, this graph shows an average of GGB and SEG estimates combined. GGB – Generalized Growth Balance Method; SEG – Synthetic Extinct Generations Method. Source: Compiled by the authors from: Stats SA, 2006, [41] 2009, [40] 2010; [17] Dorrington et al., 2001; [31] Dorrington et al., 2004; [32] Machemedze, 2009; [43] Dorrington & Bradshaw, 2011 [33].

