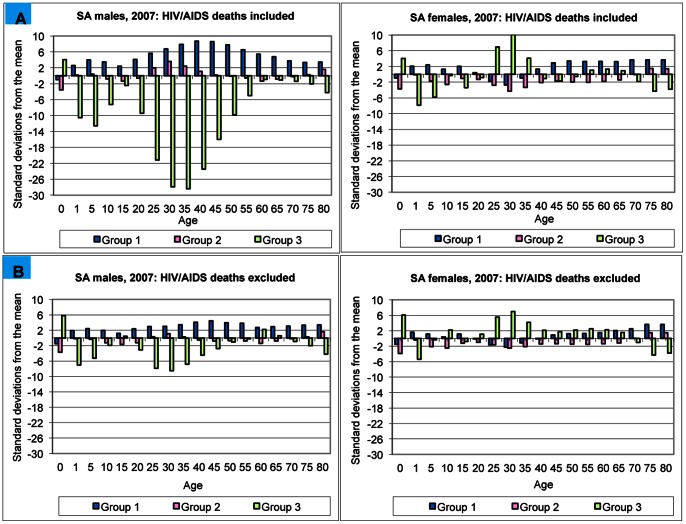
Figure 2. A. Number of standard deviations by age and sex for South Africa, 2007: HIV/AIDS deaths included.
The number of standard deviation by which observed broad-cause mortality proportions differ from mean predicted proportions when the estimated number of HIV/AIDS deaths are included in the analysis. B. Number of standard deviations by age and sex for South Africa, 2007: HIV/AIDS deaths excluded. The number of standard deviation by which observed broad-cause mortality proportions differ from mean predicted proportions when the estimated number of HIV/AIDS deaths are not included in the analysis. Source: Mortality data for 2007 from StatsSA vital registration data; [16] HIV/AIDS estimates from Bradshaw et al.; [26] population data from ASSA2008; [14] GDP data from StatsSA [25].

