
Figure 3. Anaerobic threshold measurements in CCU admitted and non CCU patients.
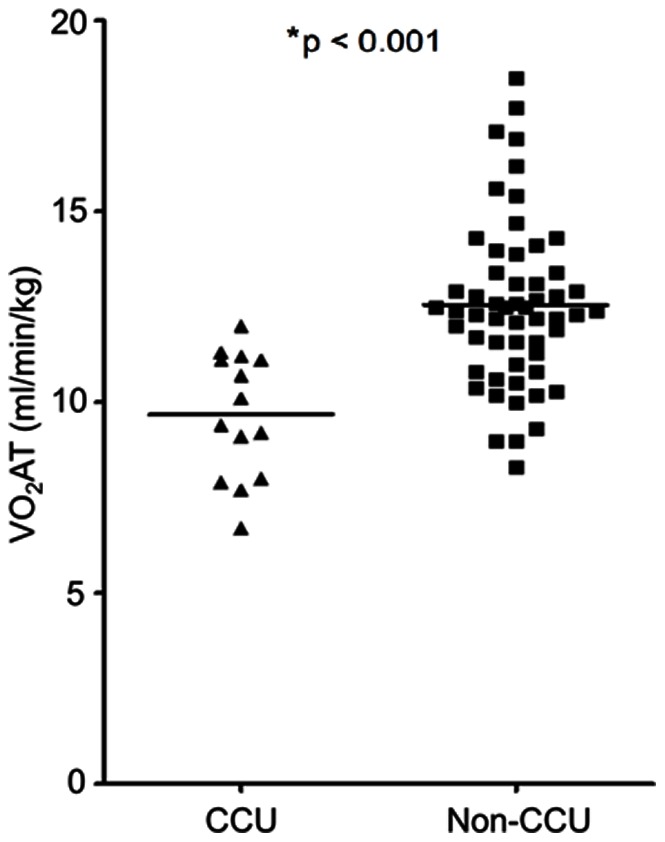
Horizontal lines refers to mean values of anaerobic threshold (VO2AT). Squares are VO2AT of non CCU patients and triangles are VO2AT of CCU admitted patients. *The p-value of the difference in the mean values of VO2AT between CCU admitted and non CCU patients.