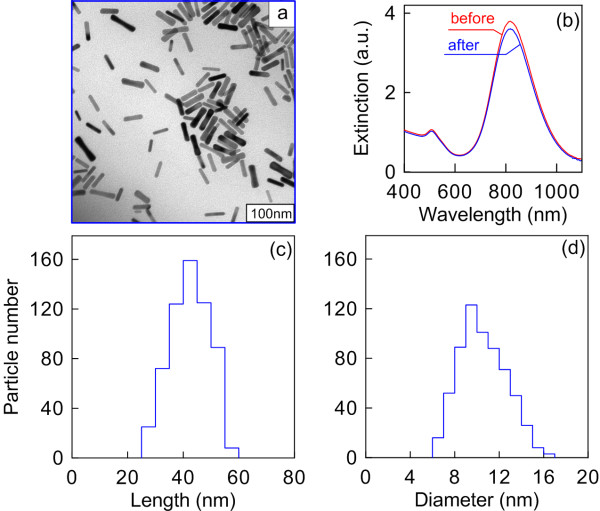
Figure 1.
TEM image, extinction spectra, GNR length distribution histogram, and GNR diameter distribution histogram. (a) TEM image of a GNR powder redispersed in water. (b) Extinction spectra of the as-prepared GNRs and GNR powder after freeze-drying. (c) GNR length distribution histogram. (d) GNR diameter distribution histogram. The average length and diameter of GNRs are both in nanometers.

