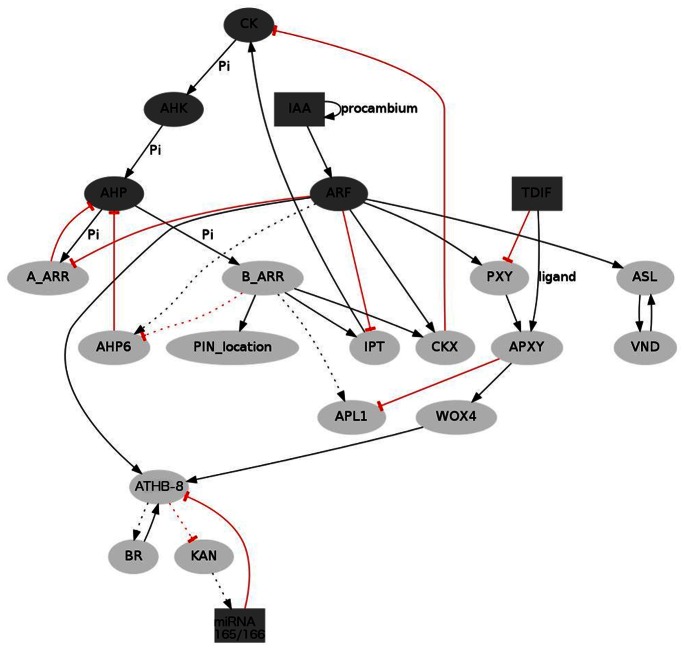
Figure 2. Summary of the experimental data used to specify the dynamic model.
Nodes correspond to different types of molecular regulatory interactors; arrows represent activation or positive regulation. Red, flat-end lines represent negative regulation. Nodes can take on only two values (0 or 1), except for the dark gray ones which can take on three (0, 1, 2). Mobile elements are represented in squares, and dotted lines indicate hypothetical interactions.

