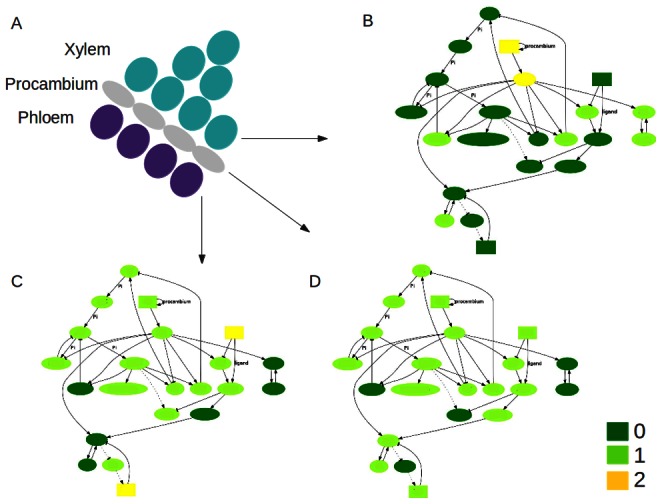
Figure 4. Network steady states characterizing each of the regions within the shoot vascular bundles.

(A) Schematic representation of a shoot vascular bundle in Arabidopsis. (B) MRN steady states corresponding to the xylem position, (C) phloem position, and (D) procambium position. The experimentally reported xylem, procambium and phloem markers peak in the corresponding positions. The position of the network nodes corresponds to that in Figure 2.
