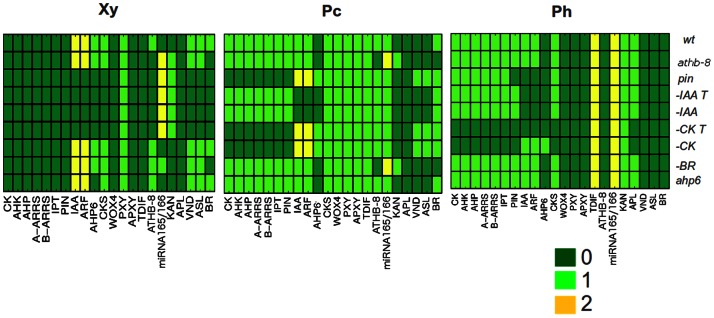
Figure 5. Mutant and hormone depletion simulations using the spatiotemporal network model.

Each horizontal line or vector represents the molecular profile of the three tissue types considered in the model. The compartment in the center corresponds to the procambium, while the compartments to the left and right correspond to the xylem and phloem, respectively. The color scale represents the states of the nodes at a given time (0, 1 or 2). Each row corresponds to the final steady profiles of a mutant or hormone-depletion simulation. In –IAA, IAA is set to 0 throughout the simulations but is present in the initial conditions. In –IAA T, IAA is set to 0 in the initial conditions and throughout the simulations. Likewise, in −CK, CK is set to 0 throughout the simulations but is present in the initial conditions. In –CK T, CK is set to 0 in the initial conditions and throughout the simulations.
