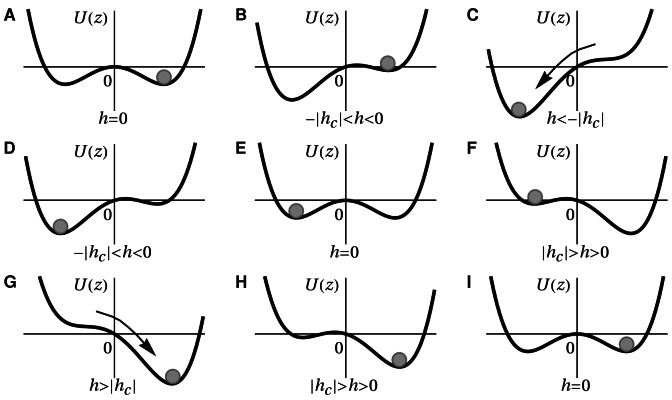
Figure 2. The hysteresis cycle in the gradient picture.
The diagrams show the stages of one hysteresis cycle starting from  (A) with the state at
  as represented by the sphere. Decreasing
  creates the asymmetric situation (B). If
  the saddle-node bifurcation happens, i. e. both the maximum at z = 0 and the right minimum disappear so that the system shifts to the left minimum of the potential (C). Increasing
  until
until  brings us back to the initial situation with the state shifted to the other well see (D,E). The diagrams (F) and (G) depict the switching from the minimum at
  to the minimum at
  by increasing
  . By decreasing
  until
until  the hysteresis cycle is finished, see (H,I).

