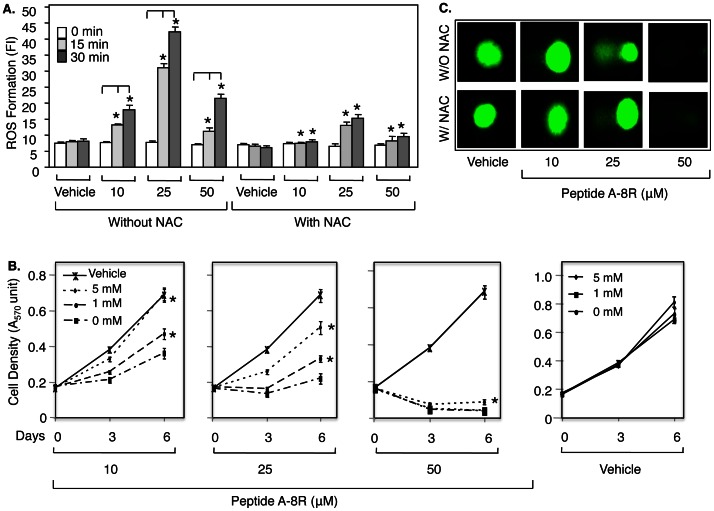
Figure 4. Peptide A-8R kills prostate cancer cells by mediating ROS generation.
(A) C81 cells were treated with Vehicle or different µMolar concentrations of Peptide A-8R and without or with 0–5 mM NAC and monitored for ROS generation after 0–30 min as measured by fluorescence intensity (FI). Bar graphs represent averages of three independent experiments plus standard deviations. Note that asterisks on bar graphs found with NAC are compared to equivalent data without NAC. (B) C81 cells were treated with Vehicle or different concentrations of Peptide A-8R, as shown, and 0–5 mM NAC, as shown, and monitored for cell number after 0–6 days of incubation as measured by MTT assay. Data points represent averages of three independent experiments plus standard deviations. Asterisks indicate statistical significance (P<0.04). (C) C81 cells were treated with Vehicle or different concentrations of Peptide A-8R, as shown, and with or without 5 mM NAC, as shown, and monitored DNA damage after 1 hr incubation as measured by Comet assay.

