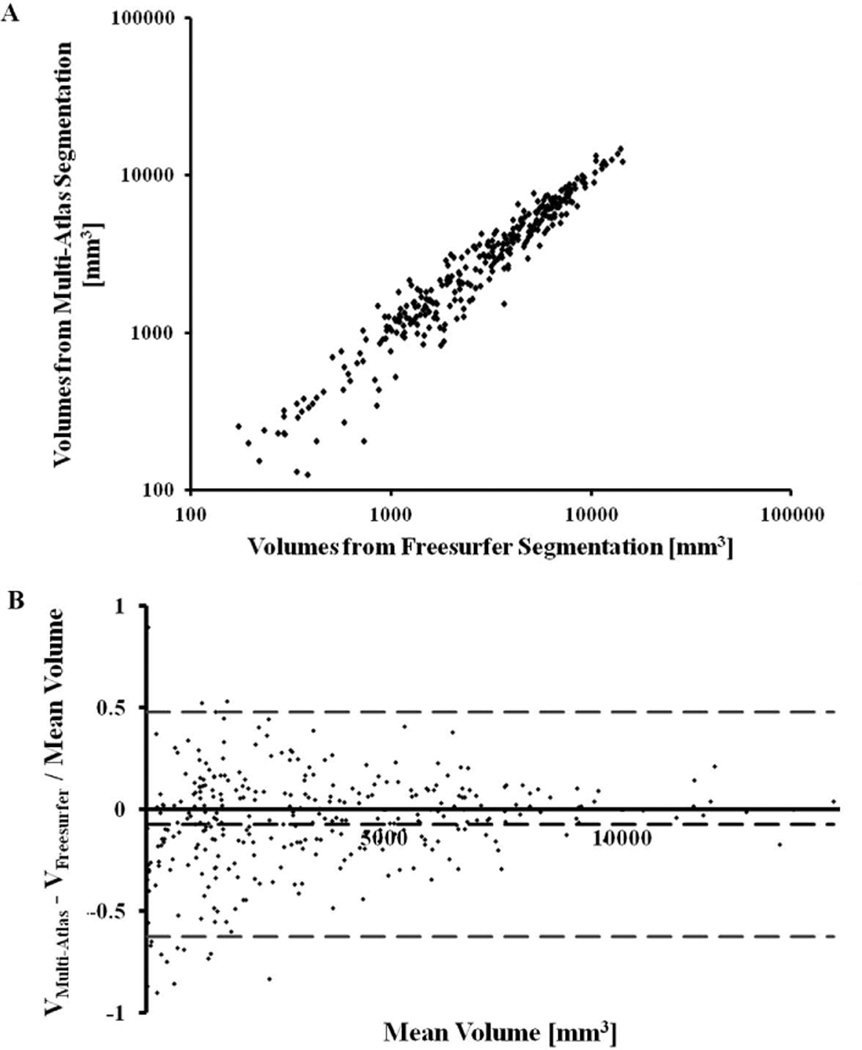
Figure 2.
A) Scatter-plot of the volume of all gray matter regions (Table 3) segmented with multi-atlas segmentation and FreeSurfer in hemisphere images simulated based on in-vivo data from 7 subjects (Dataset 3). Each point of the scatter-plot corresponds to a single region of a single subject. B) Bland-Altman plot of the relative difference in volume measured in a region with the two methods, as a function of the mean volume of that region (estimated as the mean of the volumes obtained from the two methods). Each point of the scatter plot corresponds to a single region of a single subject. The middle dashed line represents the mean of the relative differences in volume measured with the two methods, and the top and bottom dashed lines define the 95% confidence interval.

