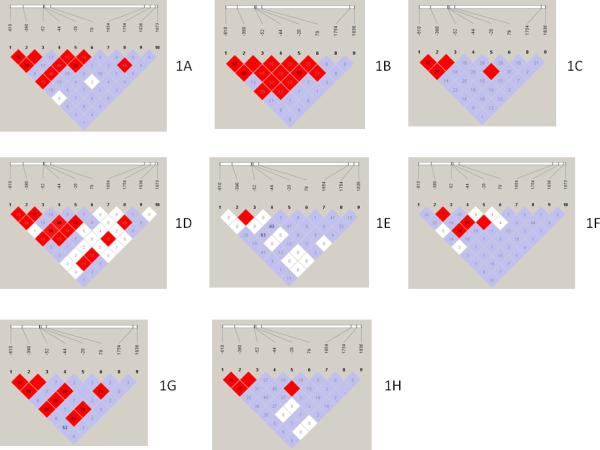
Fig. 1A-1H.

Heat maps of pairwise LD measurements for the 10 SNPs in DEFB1. 1A, CFAR white patients; 1B, MACS white, non-Hispanic patients; 1C, NE; 1D, CFAR black patients; 1E, AfSS; 1F, Af-Am; 1G, CHN; and 1H, MEX. Color scheme: bright red, D′ = 1.0 and LOD score ≥ 2.0; blue, D′ = 1.0 and LOD score < 2.0; and white, D′ < 1.0 and LOD score < 2.0. Numbers represent r2 values. r2 values of 1.0 are not shown (the box is empty).
